
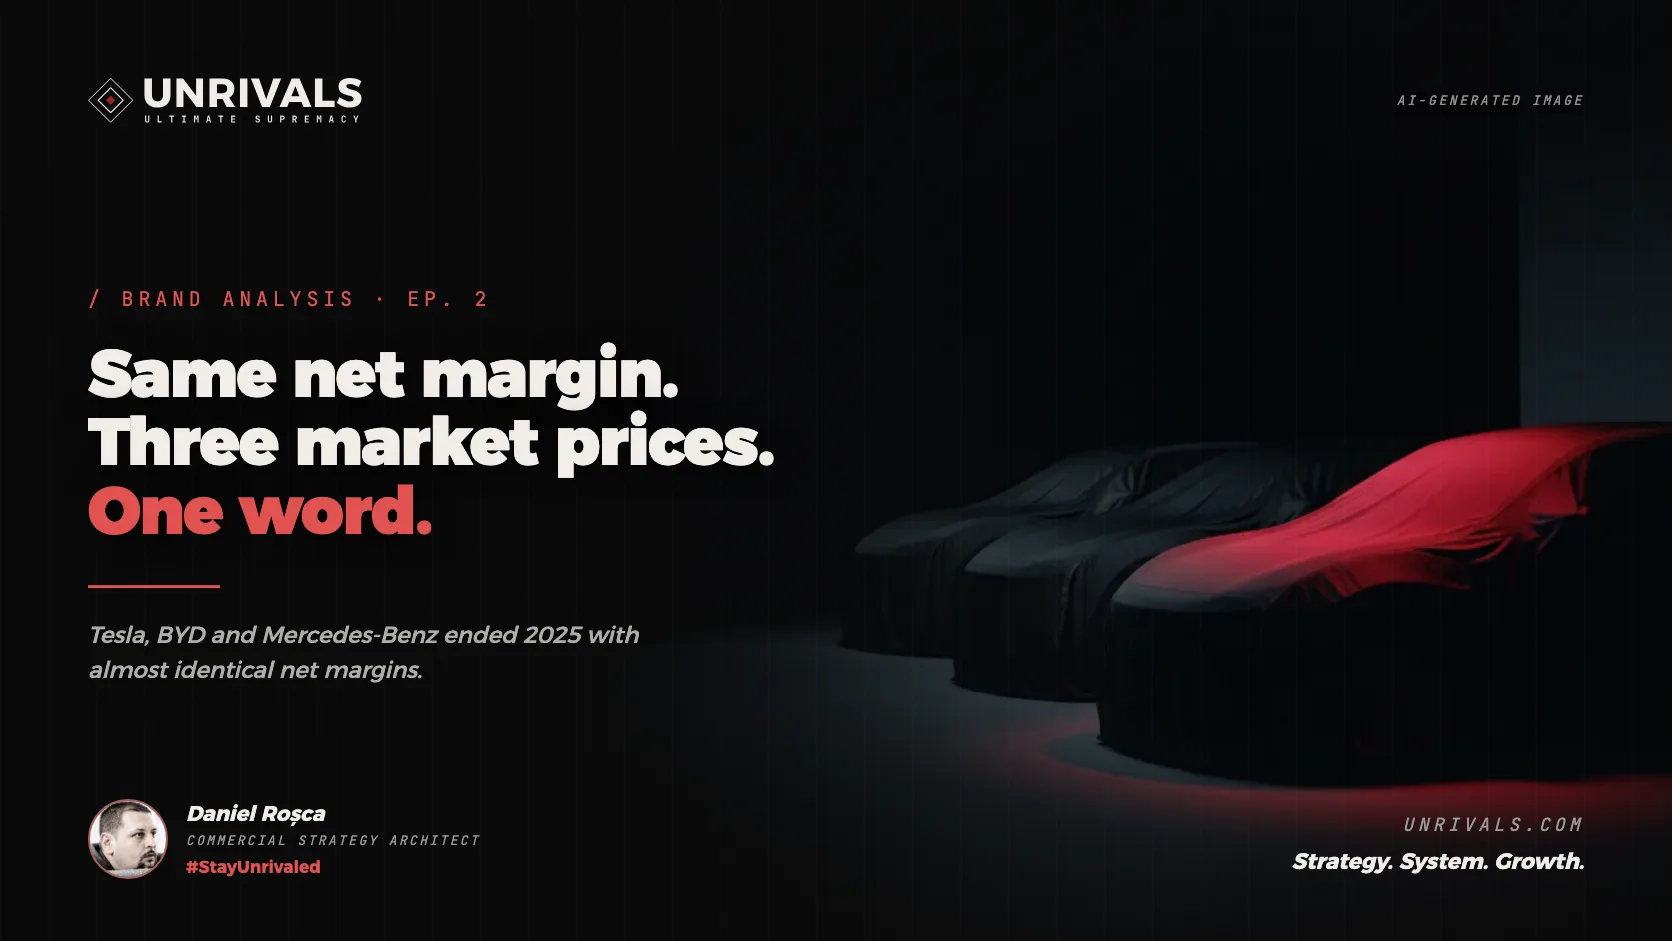
TL;DR. Tesla, BYD and Mercedes-Benz closed the 2025 financial year with net margins of 4.0%, 4.06% and 4.01% respectively: practically identical. Their stock-market capitalisations are 1,383 bn USD, 125 bn and 50 bn. The difference is not in the balance sheet. It is in the word each company owns in the buyer’s mind.
In a public experiment on 1 October 2026, Grok estimated that moving BYD onto the attribute “millennia-long durability” could add 50-100 bn USD to its market capitalisation.
The series Brand Analysis of the Week opened with three water producers from Romania (the episode is in Romanian) that illustrate a simple mechanism: the shelf price is not set by cost, but by perceived value.
This episode applies the same grid to a triangle of global companies, where the stake is not a few lei per bottle but hundreds of billions of dollars in market capitalisation.
The central mechanism is category ownership: owning a word in the public’s mind produces a valuation premium that appears in no balance sheet. Tesla owns “electric”. BYD owns “affordable”. Mercedes owns “luxury”. The 2025 balance sheets show that none of them makes more profit from each unit of revenue than the other two. Yet the market prices them completely differently.
If you are familiar with the dynamics of price wars in mature industries, this episode shows that the way out of margin pressure is never a lower price, but moving the battle onto ground where the competitor cannot enter.
The verdict
Three car companies. Almost identical net margins. Radically different market capitalisations.
Tesla: net margin 4.0%, market cap 1,383 bn USD, P/E 288.8. BYD: net margin 4.06%, market cap 125.10 bn USD, P/E 27.8. Mercedes-Benz: net margin 4.01%, market cap 49.81 bn USD, P/E 7.71.
The market does not pay for 2025 profit. It pays for the word each company owns in the mind of a buyer who has not yet bought anything from it.
Tesla owns the future. Whoever owns the future can lose volume, can see margins fall, can postpone models. The market keeps paying 288.8 times Tesla’s annual earnings, while for Mercedes it pays 7.71 times. This is not irrationality. It is the price of cognitive ownership, calculated by millions of investors at the same time.
The full analysis
2.1 The comparison table: the exact figures
| Metric | Tesla | BYD | Mercedes-Benz |
|---|---|---|---|
| Market capitalisation (Aug 2026) | 1,383 bn USD | 125.10 bn USD | 49.81 bn USD |
| Revenue 2025 | 94,827 mn USD | 803.97 bn CNY | 132.2 bn EUR |
| Net profit 2025 | 3,794 mn USD | 32.62 bn CNY | 5.3 bn EUR |
| Net margin 2025 | 4.0% | 4.06% | 4.01% |
| BEVs delivered 2025 | 1,636,129 (−9% vs 2024) | 2,254,714 (+27.9% vs 2024) | no annual figure published |
| P/E (Aug 2026) | 288.8 | 27.8 | 7.71 |
| Interbrand brand value 2025 | 29.5 bn USD (rank 25) | 8.1 bn USD (rank 90) | 50.1 bn USD (rank 10) |
| Brand Finance brand value 2026 | 27.6 bn USD (rank 6) | 17.3 bn USD (rank 11) | 40.4 bn EUR (rank 2) |
The full sources, with URLs and reading dates, are in the Provenance annex at the end of the article.
2.2 Category ownership
The UNRIVALS methodology defines category ownership as holding an attribute in the public’s mind that competitors cannot reach without giving up their own identity. The test is simple: which single word comes to mind first, spontaneously, when you hear each brand?
Tesla: electric. BYD: low-priced. Mercedes: luxury.
This simplification, one word per brand fixed in perception, produces the gap between a P/E of 288 and a P/E of 7. It is not a difference in operational performance. The margins prove it: 4.0%, 4.06%, 4.01%. It is a difference in mental category.
A buyer who wants an “electric” car does not make a rational comparison between Tesla and BYD. That buyer looks for Tesla, and BYD enters consideration only if price becomes the main argument of the decision.
A buyer who wants “luxury” goes to Mercedes, not to Tesla, even if a Tesla costs more. Mental categories are impermeable to logic once they are installed correctly and repeatedly.
The mechanism works in both directions. A brand that owns no word is valued at multiples close to the average and cannot escape margin pressure. A brand that owns an exclusive, relevant and copy-resistant word is valued at a multiple the balance sheet does not explain, but which the market pays consistently.
2.3 The central attribute score
UNRIVALS evaluates the strength of a brand attribute on a 25-point grid with five dimensions: clarity, exclusivity, relevance to the purchase decision, resistance to copying and likely longevity. Each dimension is scored from 0 to 5.
| Dimension | Tesla | BYD | Mercedes-Benz |
|---|---|---|---|
| Clarity | 5 | 4 | 5 |
| Exclusivity | 4 | 2 | 4 |
| Relevance to the purchase decision | 4 | 3 | 4 |
| Resistance to copying | 3 | 2 | 4 |
| Likely longevity | 3 | 3 | 3 |
| Total | 19/25 | 14/25 | 20/25 |
Tesla scores slightly lower than Mercedes on exclusivity for one reason: the electric market is expanding, and other brands will claim the same territory in the coming years.
Mercedes scores better on resistance to copying because luxury cannot be copied, only imitated. And imitation does not produce the same cognitive effect as the original.
BYD has a total of 14 because of the central attribute it chose. “Affordable” is easy to copy, it is not exclusive and it does not last. Anyone can lower the price further. When a competitor does exactly that, the “affordable” attribute migrates automatically to the new lowest-priced producer.
2.4 What the market says: the price-earnings ratio
The P/E of a listed company is the price the market pays for one dollar of current earnings. A P/E of 288.8 means investors pay 288.8 dollars for every dollar of Tesla’s annual profit. A P/E of 7.71 means Mercedes is valued at less than 8 dollars per dollar of profit.
Growth does not explain the gap. Tesla delivered 9% fewer electric vehicles in 2025 than in 2024. BYD grew by 27.9%. Even so, Tesla’s market cap is 11 times larger than BYD’s.
In this analysis, the P/E is the price of cognitive ownership. The market pays a premium because Tesla owns a word that no other company can take over without giving up its own identity. This is the only explanation that reconciles the figures in the table: the same margins, radically different multiples.
Mercedes illustrates a distinct case. A P/E of 7.71 does not mean the brand is weak. It means the market considers the business mature and not about to grow dramatically in the coming years.
The Mercedes-Benz brand value in the Interbrand 2025 ranking is 50.1 billion USD, more than the company’s market capitalisation (49.81 billion USD). The brand is worth roughly as much as the whole company on the stock market, a rare situation that shows the intangible asset is intact, even if the financial market does not reward it with a high multiple.
2.5 Who sells more and what that means
BYD delivered 2,254,714 electric vehicles in 2025, 37.8% more than Tesla (1,636,129). If sales volume were the only relevant factor, BYD should be worth more than Tesla on the stock market. It is not, by a factor of 11.
In Romania, interest in BYD grew 4.08 times in a year: the branded Google search “byd” rose from 22,200 per month in August 2025 to 90,500 in July 2026 and overtook the search for “tesla”. These figures describe the Romanian market.
The growth is real, but it measures awareness, not market share. People search for the name, and that opens a window; it does not yet win a position.
There is a rule in the car industry that keeps repeating: the company that wins on volume at a price attribute ends up losing on margin. Competitors enter the same ground, the market contracts, and the only operational response is cost reduction. This is the trap that the “affordable” attribute builds around whoever claims it.
Mercedes illustrates the reverse of this dynamic. It sells less than BYD and Tesla. Its market capitalisation is lower than Tesla’s. But its net margin is identical, and the “luxury” position forbids competitors from entering its ground without sacrificing their own identity.
Nobody can become “more luxurious than Mercedes” without building a completely new brand from scratch. This is the real value of category ownership: not the volume it produces now, but the competition it makes impossible.
2.6 The brand as a financial asset
Interbrand evaluates the value of global brands every year using a methodology that combines financial performance, the role of the brand in the purchase decision and the strength of the brand over the long term.
The Interbrand 2025 ranking places Mercedes-Benz 10th with a brand value of 50.1 billion USD, Tesla 25th with 29.5 billion USD and BYD 90th with 8.1 billion USD.
Brand Finance, which uses a different methodology and publishes its annual 2026 ranking, confirms the same relative hierarchy: Mercedes-Benz 2nd globally with 40.4 billion EUR, Tesla 6th with 27.6 billion USD and BYD 11th with 17.3 billion USD.
The brand value of Mercedes-Benz in Interbrand 2025 (50.1 billion USD) exceeds its current market capitalisation (49.81 billion USD). The brand is worth roughly as much as the whole company on the stock market, an unusual situation that signals a gap between the value of the intangible asset and the growth expectations of the financial market.
Tesla shows the opposite situation: its market capitalisation (1,383 billion USD) far exceeds the brand value calculated by Interbrand (29.5 billion USD). The difference is the price of the narrative. Tesla sells the future, and the financial market always rewards the story about the future over the one about the present, whatever the current balance sheet says.
The conclusion of the two rankings taken together: Mercedes has a more valuable brand as an intangible asset and a company valued at a much lower stock-market multiple.
Tesla has a smaller brand as an asset and a company valued at an unprecedented multiple in the industry. BYD has the smallest brand of the three and is growing fastest in volume.
2.7 The BYD context: growth that does not produce brand value
Over the last five years BYD has built the fastest growth programme in the history of the car industry. It overtook Tesla in BEV sales volume in 2025. It has a new factory in Hungary, which will produce for the European market from 2026. Its presence in Romania has grown more than fourfold in a single year.
And yet BYD is valued on the stock market at 11 times less than Tesla.
The explanation is not operational. It is cognitive. BYD does not own any relevant word in the mind of a European buyer formed before 2022. “Low-priced” is not an attribute you want to own, because it is the first to migrate the moment a competitor cuts the price below yours.
The Chinese context matters: BYD grew predominantly in its domestic Chinese market, where brand associations are different and where price is a more culturally respected attribute. Exporting this position to European markets does not work automatically, because perception does not travel together with the goods.
Investment in volume growth, without parallel investment in category ownership, produces a large, profitable company valued at a low multiple. That is the price of lacking a word.
2.8 The UNRIVALS move for BYD
If BYD were a UNRIVALS client and the objective were to raise brand value in the European market, the recommendation would not be to grow volume even further. It would be to move the central attribute.
From “affordable”, an attribute that is easy to copy, not exclusive and not lasting, towards an attribute with resistance to copying and growing relevance in Europe: battery safety.
BYD has a real technical advantage in Blade battery technology, which has passed fire and impact safety tests that competitors have not publicly matched. This is a candidate attribute for category ownership, because it meets the essential criteria:
- It is verifiable: the tests are publicly documented through independent sources.
- It is exclusive in perception: no other mass-market producer has communicated battery safety as the central attribute of its brand.
- It is relevant to the European purchase decision: anxiety about electric-vehicle fires is documented in market studies from Germany, France and the Netherlands.
- It resists copying: competitors could replicate the technology over time, but they cannot replicate the mental association once it is installed.
The time horizon for installing this attribute in European markets is 12 months of consistent communication: a European safety campaign, documentation of the tests in a format accessible to the general public, consistent positioning at every touchpoint.
If the move succeeds, BYD no longer competes on price. It competes on trust. And trust produces a valuation multiple different from the one produced by sales volume.
2.9 The public experiment: what BYD would gain from the attribute “millennia-long durability”
On 1 October 2026 I took the move from the previous section one step further, in an experiment carried out in the open, on X, with Grok, the platform’s AI model. I asked what would happen to BYD’s valuation if the central attribute “affordable” were replaced with millennia-long durability.
The hypothesis has two levels, and each supports something the other cannot support alone. The battery safety from section 2.8 becomes the first level of a larger story.
The first level is the technical proof. According to BYD, the Blade battery exceeds 3,000 charge and discharge cycles, the equivalent of 1.2 million kilometres, and in the test where the battery is pierced by a nail the surface temperature stays below 60°C.
This is durability that an engineer, a fleet manager or a leasing appraiser can verify on their own.
The second level is the cultural anchor. The painted pottery of the Yangshao culture, from the Yellow River basin, is dated by Encyclopaedia Britannica between 5000 and 3000 BCE, so it is between 5,000 and 7,000 years old.
The vessels were painted with red and black mineral pigments and fired in kilns dug into the ground, and the colour has survived millennia buried.
In the reading I proposed and Grok adopted, the red ochre on these vessels carries the oldest signals the human mind recognises, namely life, continuity and group identity. The Blade battery carries the same signals in today’s language, through safety, thermal stability and endurance over time.
- Copied through price
- Migrates to the lowest-priced
- Exclusivity 2 out of 5
- Blade, over 3,000 cycles
- Yangshao, 5,000-7,000 years
- Proof plus cultural anchor
The left column is the position BYD occupies today, with the exclusivity score it received in the grid in section 2.3. The right column puts the two levels of the hypothesis side by side, and neither of them can be bought by a competitor through a price cut.
Grok’s answer, published on X on 1 October 2026, is that durability on two levels would move BYD from the category of affordable volume into the longevity-premium category.
Its estimate is a valuation multiple rising from around 20 towards 30-40 times earnings, with 50-100 billion USD added to market capitalisation, average prices 5-10% higher outside China and residual values 10-15% better.
These figures are the estimate of an AI model, and the base Grok starts from differs from the table in section 2.1.
Grok works with a P/E of around 20 and a market capitalisation of around 100 billion USD for BYD, while our August 2026 data show 27.8 and 125.10 billion. The direction of the move holds, and its size remains a hypothesis to test.
The most useful part of the exchange is the objection Grok raises on its own.
It accepts that the Yangshao story creates a cultural exclusivity that is hard to copy, which raises the valuation multiple the same way category ownership does. It insists, however, that in global markets verifiable technical attributes, such as the safety of the Blade battery, move valuation directly and measurably, while the cultural story amplifies it.
That is why the order matters, because technical proof opens the door and the 5,000-year story keeps it open long after competitors reach the same battery chemistry. A competitor can cut its price below BYD’s in a single quarter. That same competitor cannot shorten the years of testing behind a battery, and cannot buy the history of Chinese ceramics.
The same mechanism works at country scale. The Cucuteni culture from the Romanian space and the Yangshao culture from China are two independent Neolithic convergences, neither derived from the other, and this symmetry allows a Romanian company to speak with an Asian industrial partner as an equal.
The theme is on the agenda of the forum “The Transformation of Global Industrial Ecosystems”, taking place on 20 October 2026 in Sibiu, where UNRIVALS is the business and strategy audit partner.
The exercise applies to any company and fits in two lines. On the first line you write the technical proof a sceptical buyer can verify. On the second line you write the anchor that makes it hard to copy, whether that is a history, a place or a trade passed down through generations.
If the second line stays empty, your attribute can be taken by the first competitor who cuts the price.
Provenance annex
Every figure in the analysis above has a verifiable source. The table follows the order of first appearance in the text.
| Figure | Source | Date read |
|---|---|---|
| Tesla market cap 1,383 bn USD | Yahoo Finance · TSLA | Aug 2026 |
| BYD market cap 125.10 bn USD | Yahoo Finance · BYDDF | Aug 2026 |
| Mercedes-Benz market cap 49.81 bn USD | Yahoo Finance · MBG.DE | Aug 2026 |
| Tesla revenue 94,827 mn USD (2025) | Tesla Investor Relations · Q4 2025 | Aug 2026 |
| Tesla net profit 3,794 mn USD (2025) | Tesla Investor Relations · Q4 2025 | Aug 2026 |
| Tesla net margin 4.0% | Own calculation: 3,794 ÷ 94,827 × 100 | Aug 2026 |
| BYD revenue 803.97 bn CNY (2025) | BYD Annual Report 2025 | Aug 2026 |
| BYD net profit 32.62 bn CNY (2025) | BYD Annual Report 2025 | Aug 2026 |
| BYD net margin 4.06% | Own calculation: 32.62 ÷ 803.97 × 100 | Aug 2026 |
| Mercedes-Benz revenue 132.2 bn EUR (2025) | Mercedes-Benz Group · Annual Report 2025 | Aug 2026 |
| Mercedes-Benz net profit 5.3 bn EUR (2025) | Mercedes-Benz Group · Annual Report 2025 | Aug 2026 |
| Mercedes-Benz net margin 4.01% | Own calculation: 5.3 ÷ 132.2 × 100 | Aug 2026 |
| Tesla BEVs 1,636,129 units (2025) | Tesla Vehicle Deliveries Q4 2025 | Aug 2026 |
| Tesla BEV change −9% vs 2024 | Compared with 1,808,581 units delivered in 2024 (Tesla Q4 2024) | Aug 2026 |
| BYD BEVs 2,254,714 units (2025) | BYD Sales Data · Release, Jan 2026 | Aug 2026 |
| BYD BEV change +27.9% vs 2024 | Compared with 1,762,870 units delivered in 2024 (BYD, Jan 2025) | Aug 2026 |
| Tesla P/E 288.8 | Yahoo Finance · TSLA | Aug 2026 |
| BYD P/E 27.8 | Yahoo Finance · BYDDF | Aug 2026 |
| Mercedes-Benz P/E 7.71 | Yahoo Finance · MBG.DE | Aug 2026 |
| Interbrand 2025: Mercedes rank 10, 50.1 bn USD | Interbrand Best Global Brands 2025 | Aug 2026 |
| Interbrand 2025: Tesla rank 25, 29.5 bn USD | Interbrand Best Global Brands 2025 | Aug 2026 |
| Interbrand 2025: BYD rank 90, 8.1 bn USD | Interbrand Best Global Brands 2025 | Aug 2026 |
| Brand Finance 2026: Mercedes rank 2, 40.4 bn EUR | Brand Finance · 2026 automotive ranking press release | Aug 2026 |
| Brand Finance 2026: Tesla rank 6, 27.6 bn USD | Brand Finance · 2026 automotive ranking press release | Aug 2026 |
| Brand Finance 2026: BYD rank 11, 17.3 bn USD | Brand Finance · 2026 automotive ranking press release | Aug 2026 |
| Branded search “byd” in Romania, Aug 2025: 22,200/month | DataForSEO · Google Ads search volume (location Romania, language ro) | Aug 2026 |
| Branded search “byd” in Romania, Jul 2026: 90,500/month | DataForSEO · Google Ads search volume (location Romania, language ro) | Aug 2026 |
| Growth in BYD branded search: 4.08× | Own calculation: 90,500 ÷ 22,200 | Aug 2026 |
| BYD BEV lead over Tesla: +37.8% | Own calculation: (2,254,714 − 1,636,129) ÷ 1,636,129 × 100 | Aug 2026 |
| Tesla ÷ Mercedes capitalisation ratio: 27.8× | Own calculation: 1,383 ÷ 49.81 | Aug 2026 |
| UNRIVALS central attribute score (19/14/20 out of 25) | UNRIVALS internal assessment on the five-dimension grid | Aug 2026 |
| Blade battery: over 3,000 cycles, the equivalent of 1.2 million km; below 60°C when pierced by a nail | BYD UK Media · press release on the Blade battery warranty | Oct 2026 |
| Yangshao culture: 5000-3000 BCE, painted pottery | Encyclopaedia Britannica · Yangshao culture | Oct 2026 |
| Grok estimate: P/E from ~20 towards 30-40, +50-100 bn USD market cap, ASP +5-10% outside China, residual values +10-15% | Grok on X, 1 October 2026 (estimate by an AI model, on a different base from table 2.1) | Oct 2026 |
Frequently asked questions
Why is Tesla valued more than BYD if BYD sells more electric cars?
Market capitalisation does not reflect current sales. It reflects expectations about future value and a brand’s ability to maintain or extend its price premium over competitors.
Tesla owns the word “electric” in the mind of the global public. This cognitive ownership produces a valuation multiple of 288.8, which the current balance sheet does not justify, but which the market pays consistently.
BYD sells more, but it owns the attribute “affordable”, which does not produce the same kind of expectation and which migrates automatically to the new lowest-priced producer in the category.
What is category ownership and how is it measured?
Category ownership is the ability of a brand to be synonymous with a category or an attribute in the public’s mind.
The test is simple: which brand do you think of first, spontaneously, when you hear the word “electric”? If the answer is consistent across a broad public, that brand owns the category.
It is measured through spontaneous-association surveys, through analysis of organic searches and, indirectly, through the valuation multiple relative to competitors with similar financial performance.
Mercedes has a more valuable brand than Tesla according to Interbrand, but a lower market cap. How is that possible?
The Interbrand and Brand Finance methodologies calculate the value of the intangible asset based on the role of the brand in the purchase decision and its long-term strength. They do not take future growth narrative into account.
The future growth narrative is the dominant factor in Tesla’s stock-market valuation. Mercedes has a strong brand, valued at 50.1 billion USD by Interbrand, and a company valued at a P/E of 7.71 on the stock market.
The financial market considers that the Mercedes business will not grow dramatically. This does not mean the brand is weak. It means the business is mature.
Can BYD become a premium brand in Europe?
It can, but not by growing volume on the “affordable” attribute. Growth on this attribute reinforces exactly the position it wants to escape.
The transition to a premium attribute requires gradually giving up price communication and building an exclusive attribute: battery safety, charging technology or range are plausible candidates.
The realistic horizon for such a transition in European markets is 3 to 5 years of consistent communication, with brand investment separate from distribution investment.
What would happen if BYD changed its central attribute from “affordable” to “durability”?
In a public experiment on 1 October 2026, Grok estimated that BYD would move from the category of affordable volume into a premium-longevity category, with a higher valuation multiple and 50-100 billion USD added to market capitalisation.
The estimate starts from a different base than the figures in this analysis, so its size remains a hypothesis. The direction does have support in verifiable data, because the Blade battery exceeds 3,000 cycles and the Yangshao cultural anchor is between 5,000 and 7,000 years old and cannot be copied by any competitor.
What relevance does this analysis have for a brand from Romania?
The mechanism is identical, whatever the scale of the brand. A local producer competing on price is caught in the same trap as BYD: anyone can cut the price lower.
The solution is not to win the price battle, but to avoid it through an attribute that the competitor cannot copy without sacrificing its own identity.
The analysis in the previous episode of this series, on Aqua Carpatica, Borsec and Dorna, shows the same mechanism applied to the bottled-water industry in Romania.
If you want to find out which word your brand owns in your customers’ minds and what value that produces or loses, request a free 30-minute brand audit.
This is an independent analysis based exclusively on public data. The financial figures come from the companies’ annual reports and press releases, checked in August 2026. The Interbrand and Brand Finance brand valuations are taken from the public rankings of these organisations. None of the companies analysed is a UNRIVALS client or took part in preparing this analysis.
Section 2.9, on the public BYD rebranding experiment, and the corresponding rows in the annex were added on 2 October 2026.