
A marketing budget is the amount a company invests to be found, understood and chosen by the right customers. The money does not work on its own, because it amplifies whatever foundation it finds.
On a good foundation, every extra euro produces more than the one before it. On a broken foundation, the extra euro carries the same crack further down the line.
TL;DR. When marketing stops bringing in customers, the reflex is to raise the budget. On a broken foundation, meaning no clear attribute, no visible proof and no coherent path to the sale, extra money buys more impressions, not more customers.
Cost per click rises, acquisition cost rises with it, and the number of customers stays flat. That is why the diagnosis comes before the budget, and the budget increase comes after it, never the other way around.
This article does not repeat what a marketing strategy is, a subject I covered separately in the guide to marketing strategy for companies between three and thirty million euro. Here I follow the money, euro by euro, along its real path, to show where it gets lost and what needs fixing before the budget grows.
Why isn’t my B2B marketing working even though I’m spending?
B2B marketing usually stalls because the budget works on a foundation that will not let it perform. The buyer sees the ad, lands on the site, and compares it with the alternatives.
Along the way, the buyer finds no reason to choose this company over the next one on the list. The money gets the buyer to the decision point, and the decision gets lost right there.
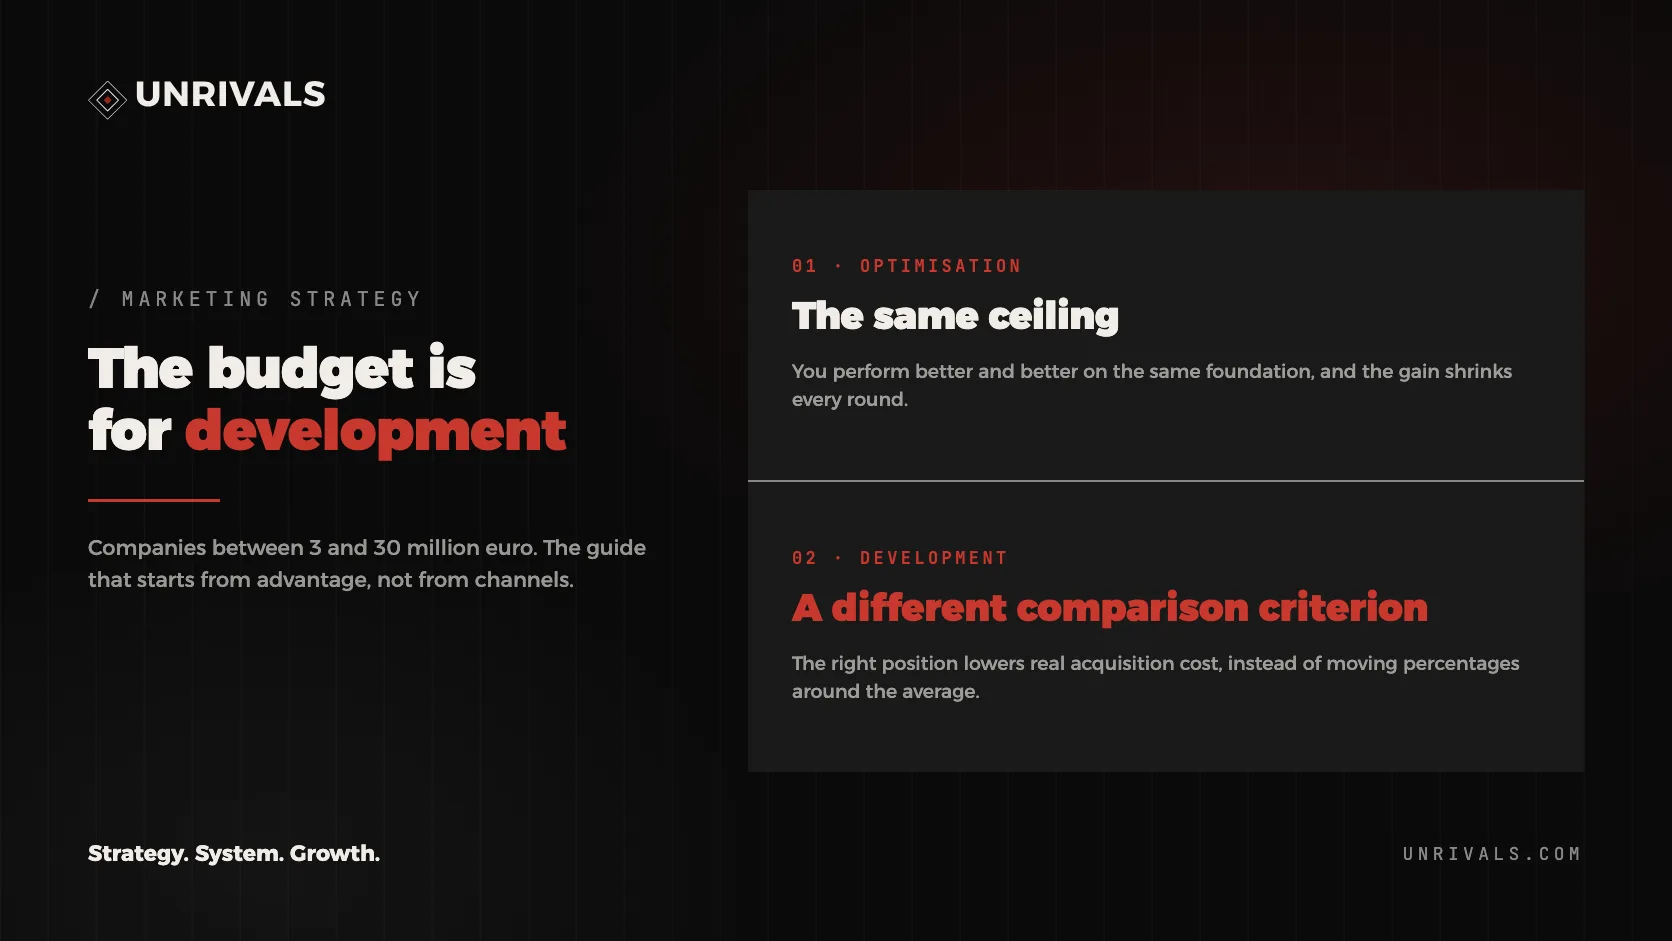
I tell the founders I work with that the marketing budget exists for development, for strategy and for architecture, and that endlessly optimising the same channel only pays for the upkeep of the ceiling the company already has. That line comes from the audits I have run at companies that had already taken the obvious step and raised the budget.
The pattern repeats almost identically. The company has a good product, a team that delivers, and a few large customers who recommend it. Marketing started as ads on Google or LinkedIn, worked for a while, then stalled at a level no campaign adjustment can lift any further.
Two proposals show up at that point. The first comes from whoever runs the ads and asks, as a rule, for more budget, on the argument that the market is there. The second comes from inside the company and asks for a new channel, TikTok, a podcast, or one more trade show.
Both proposals start from the same assumption, that the problem is the amount of exposure.
That assumption is almost always wrong at solid companies. Their real problem is the lack of a clear reason to be chosen, and the difference shows up on a single question I ask at the start of every audit.
If a buyer saw your website next to your three closest competitors, with the logos covered, would they know which one is yours?
When the answer is no, no amount of money fixes the problem through volume. The money brings the buyer in front of a choice they cannot make in your favour, so they choose on the only criterion left within reach, meaning price.
That is where the price war begins, a symptom of a market that has no other way to compare two companies that look, from the outside, identical. I described the mechanism separately, in the analysis of how companies get out of a price war.
What does one extra euro actually do on a broken foundation?
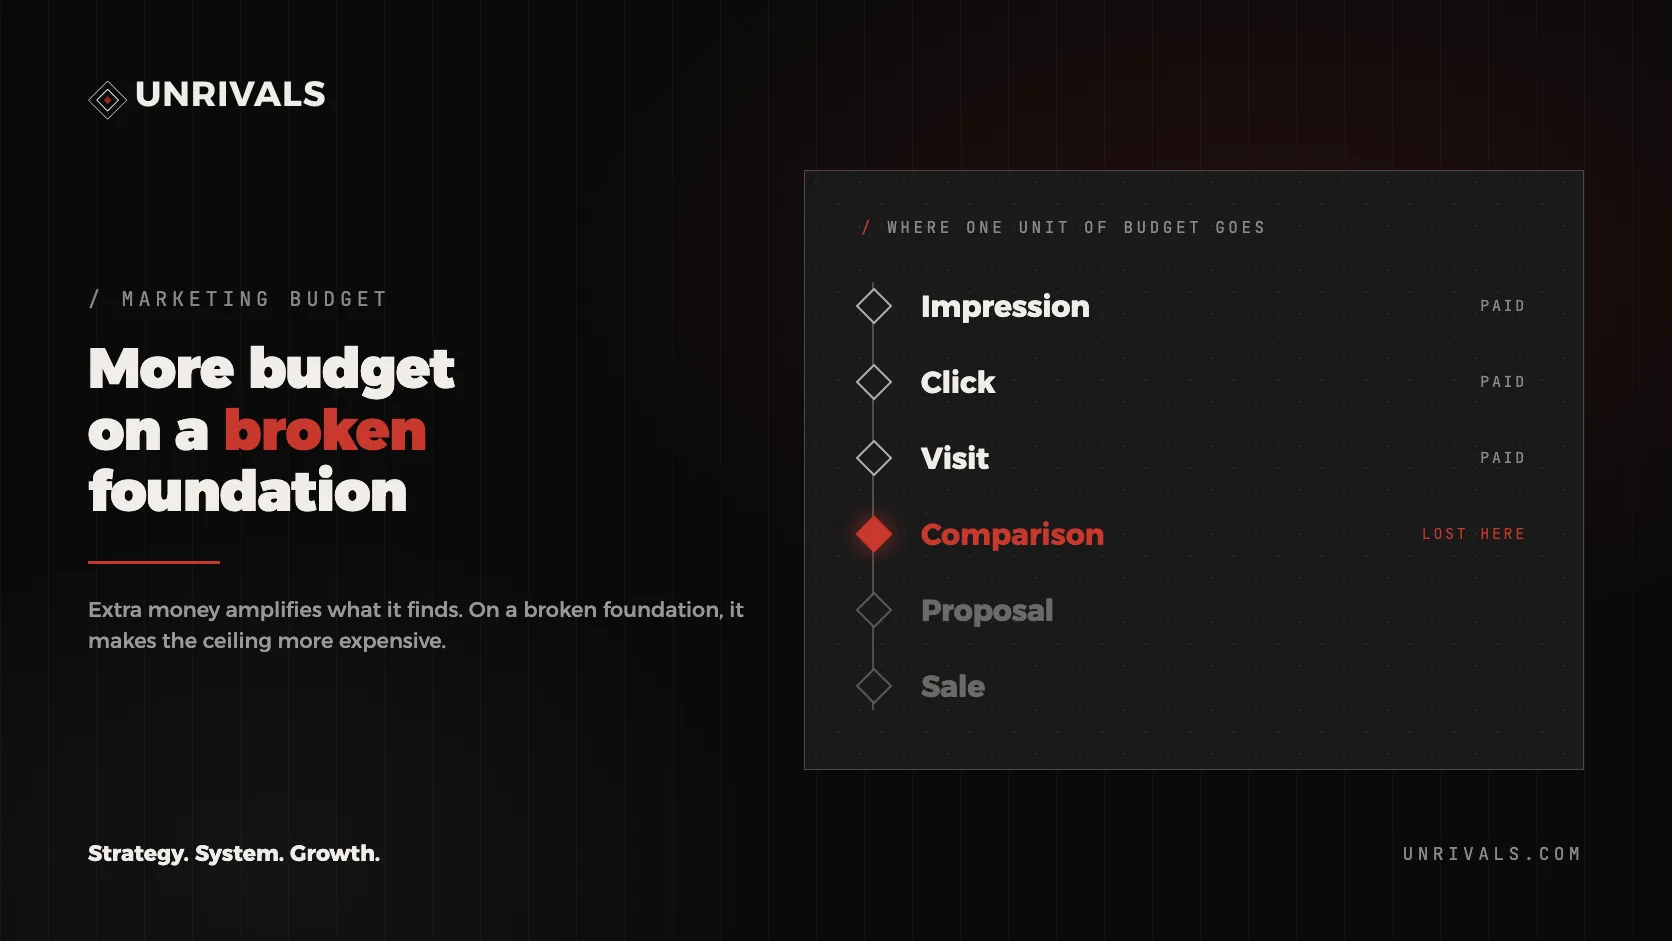
An extra euro travels the same path as every euro before it, from impression to sale, and pays a tax at every link proportional to how hard it is for the buyer to understand the offer.
On a broken foundation, the highest tax gets paid at comparison, the point where the buyer has to decide why you and not someone else.
I call that tax the cognitive cost. An unclear brand puts a tax on every impression, because the buyer has to think harder to understand what the company actually sells, and the more they think, the lower the odds they go further.
Lowering the cognitive cost is the bridge between branding and performance. The same ad, on the same audience, costs less per click and brings in more per lead the moment the message gets understood on first read, without a second look.
- ImpressionThe ad reaches the buyer
- ClickThe buyer wants to learn more
- VisitThe website explains the offer
- ComparisonThis is where the euro is lost
- OfferThe request reaches sales
- SaleThe contract gets signed
The red link in the chain is where most budgets get lost quietly. Impressions and clicks show up in the reports, so they look healthy, and the sale shows up in the accounting. Comparison shows up nowhere, because it happens inside the buyer’s head, with three tabs open and nobody there to talk to.
When the budget grows, the first two links grow proportionally, so the campaign report looks good. The number of people who reach comparison grows too, except the share who make it through comparison stays the same. The final result grows far slower than the spend, and the cost per customer climbs from one month to the next.
There is a second reason extra money raises the price of the ceiling instead of breaking it.
Professor John Dawes at the Ehrenberg-Bass Institute found that only around 5% of B2B buyers are in the market at any given moment, while the other 95% will not buy in the coming months, according to research published by the LinkedIn B2B Institute in 2021.
- Not buying right now95%
- Ready to buy right now5%
Source · John Dawes, Ehrenberg-Bass, LinkedIn B2B Institute, 2021
Nearly all of the performance budget hunts those 5%. Paid search, retargeting and conversion ads only reach the person who is already looking, and every competitor is hunting that same person at the same moment. More money from your side simply raises the price of the auction for the same buyer, without growing the number of people who are searching.
Auction data confirms the mechanism at scale. The cost per click on Google Ads rose in 87% of industries in 2025, after rising in 86% of them the year before, and the average across all industries climbed 12.88%, according to the 2025 WordStream benchmark report.
- 87%Of industries with rising CPC in 2025
- +12.88%Average CPC increase
For a company with a solid foundation, that inflation is unpleasant but bearable, because every expensive click turns into a customer more often than not. For a company with a broken foundation, the same inflation stacks on top of the cognitive tax, and the cost per customer rises from both directions at once, every single month.
How much should a company invest in marketing?
The average marketing budget sits at 7.8% of revenue in 2026, according to the 2026 Gartner CMO Spend survey, though the percentage says less than how the money gets split. The useful question is how much of the budget works for tomorrow’s buyers and how much only works for today’s.
The same survey shows how far budgets have tightened. The 7.8% average sits 18% below the average allocation of four years ago, and paid media takes up 31.4% of the budget, according to Gartner’s 2026 data.
Marketing leaders feel the pressure directly. In 2025, 59% of them said they did not have enough budget to execute their strategy, according to the 2025 Gartner press release.
Ewan McIntyre, Vice President and Head of Research in the Gartner marketing practice, described their response in the same release, saying that “With limited funds, marketing leaders are boosting productivity in order to drive growth.”
His observation matters here, because the productivity of a budget depends first on the foundation it works on, and only after that on the tools used to manage it day to day.
The split between brand and activation has its own reference figure. Les Binet and Peter Field, the researchers who analysed the IPA effectiveness data, found an optimal B2B split of 46% brand and 54% activation, according to the analysis published by The Drum in 2019.
The two researchers present the ratio as an average, so it shows a direction rather than a recipe to apply blindly to every company. Brand works with the 95% who are not buying now, so the company is the first name that comes to mind once they enter the market, and activation works with the 5% who are already looking.
A company that puts the whole budget into activation only competes for the 5%, exactly where the auction is most expensive. When those 5% reach comparison and find no clear reason to choose, the company pays twice, once for the click and once for the discount it offers to try to win the contract.
This is where the meaning of brand as a foundation for growth becomes visible. On a correct foundation, every euro invested leaves memory behind, meaning a buyer who remembers the name once the need appears months later. On an ad that only asks for a click, nothing remains once the campaign stops running.
On which layers does the foundation break?
A company’s foundation has four layers, and the marketing budget only works on the first one. If the break sits higher, in positioning, in the commercial process, or in how the company uses its own data, money put into the first layer cannot repair it.
That is why the diagnosis starts at the top, at positioning, even when the symptom shows up at the bottom, in cost per lead.
- L4 · Positioning and categoryThe reason you get chosen
- L3 · AI Brain, orchestrationHow the company learns from its own data
- L2 · Revenue and commercial processWhat happens to the lead after the form
- L1 · Performance marketingWhere the budget works
L1, performance marketing. This is where the ads, the landing pages and everything measured in cost per click, cost per lead and ROAS live. It is the only layer the budget touches directly, which is why every conversation about budget stops here, even when the problem sits somewhere else entirely.
L2, revenue and the commercial process. The lead the ad brings in reaches a person in sales, and what happens next decides whether the money comes back.
A lead called three days late, an offer sent without context, or a sales team describing the product differently from the ad breaks the chain even when marketing did everything right on its side.
L3, AI Brain. This layer shows how well the company uses its own data to decide what to do next. It is also where money gets lost in tools nobody finishes setting up.
Gartner found in 2023 that marketing teams use only 33% of the capabilities in the tools they already pay for, down from 58% in 2020, according to the 2023 chiefmartec analysis.
That figure describes the same problem as the media budget, in a different shape. The company buys capacity before it has the process that would use it, and the invoice grows while the result stays flat. I wrote at more length about how data becomes decision in the article on AI Brain for founders.
L4, positioning and category. This layer answers the question the buyer asks at comparison, meaning why you. It decides whether the company pays the cognitive tax or not. When L4 is missing, the company lists thirty capabilities and forces the buyer to work out on their own why any of them matter, and the tired buyer chooses on price.
The order matters more than it looks. Building a company runs bottom up, from traffic to revenue and then to positioning, while the message gets derived top down, from positioning to the offer and only then to the advertisement.
A bigger budget on L1 without L4 buys an ad with nothing left to say, no matter how skilfully it gets managed by whoever runs the account.
Infrastructure comes before marketing, and that rule is the first one I apply at every new company I audit. Before any ad, I check whether there is a clear attribute and its proof, a sales process that actually picks up the lead, and data that shows where it currently gets lost.
The complete map of the layers, including how they connect to each other, sits in the article on marketing architecture.
What does the difference look like on a real company?
The difference shows up most clearly at a company that went through both situations. Cardio Clinic, a cardiology clinic in Bucharest, spent years stuck at a ceiling with a growing budget, then rebuilt the foundation and grew with a bigger budget, this time with a result to show for it.
The case study is public and every figure carries its source.
The starting point, described in the Cardio Clinic case study published on unrivals.ro, was a clinic where Google Ads brought in over 90% of patients. The clinic had been stuck at a ceiling for years, and no matter how much the budget grew, the number of new patients stayed about the same month after month.
The diagnosis from the UNRIVALS team, led on the growth side by my partner, Daniel Ene, was that the clinic lacked a multi-channel strategy that created demand for it in the first place. More money in the same channel kept raising the price of the same ceiling without ever breaking through it.
The ads got rewritten around what the patient actually feels and searches for, and the clinic got a real presence on social channels.
- +39%Revenue
- +57%Appointments
- −22.5%Cost per conversion, brand search
Source · Cardio Clinic case study, the clinic's dashboard and Google Ads exports, 2026
The results, measured over January-April 2026 against the same period in 2025, show +39% revenue and +57% appointments, according to the clinic’s dashboard cited in the 2026 case study. On the Google Ads search campaigns, conversions rose 35% over the same window.
The part that matters for this article is different. The search budget grew by more than 30%, and the cost per conversion on brand search fell at the same time by 22.5%, according to the same case study. Extra money produced more per euro spent, something that was simply impossible on the earlier foundation.
The case shows something that often gets lost in the budget conversation. Raising the budget is not wrong in itself, and at Cardio Clinic it was the right decision. It worked because it came after the foundation got rebuilt, in a sequence where every step prepared the next one properly.
I see the same mechanism at the industrial companies I audit, except there the fix often needs even less new money to start. In the audit for Cablero Steel Group, a manufacturer of cables and lifting devices, I proposed three moves for the first ninety days that leaned on what the company already had, with no new budget attached.
The moves were simple. Store-level promises, such as free shipping and fast delivery, had to come off the home page, because they placed the company in the same category as the stores that resell its products to end buyers.
Proof of approved-supplier status, meaning the large industrial customers and the certifications, already existed inside the company, it simply never appeared on the home page where a buyer could see it.
The company already had everything it needed for comparison. What it lacked was the order in which it showed the proof to the people deciding.
How do you diagnose the problem before you raise the marketing budget?
The diagnosis runs on signs you can see with no special tool, in the reports the company already has open on a screen somewhere. Each sign points to a specific layer, and each layer has a fix that comes before the money. The table below is the short version of the check I run at the start of every audit.
| Signal you see | Broken layer | What you fix before the budget |
|---|---|---|
| Cost per lead rises while clicks stay flat | L4, positioning | The central attribute and its proof, on the home page |
| Many leads, few contracts | L2, commercial process | Response time and one shared message between marketing and sales |
| Customers always negotiate the price | L4, positioning | A comparison criterion other than price |
| Nobody searches for the company by name | L4, brand memory | The name, the permanent tagline, and their repetition |
| Paid tools sit unused | L3, data and orchestration | The process that uses the data, before another license |
| One channel brings in almost everything | L1 and L2 | A second source of demand, on a small test |
The first sign matters most, because it shows up earliest of all. When clicks stay flat and cost per lead rises, the ad works and the site attracts visitors, except the people who land there find no reason to leave their details behind.
The problem sits between the click and the form, meaning at L4, and a bigger budget only brings in more people who leave without converting.
The second sign, many leads with few contracts, is the one marketing and sales throw at each other. Marketing says it brought in leads, sales says the leads are poor quality.
The truth usually sits in the middle, in a funnel where the two teams do not speak the same language, a subject I covered in the article on B2B sales as a system.
The third sign, constant price negotiation, is the direct consequence of a comparison the company is not winning on anything else. The buyer negotiates because they see no difference that would justify the price being asked. The fix is building a second dimension of comparison, meaning an answer to what the company actually stands for.
The fourth sign gets checked in ten minutes inside Google Search Console, where you see how many people search for the company by its own name. Branded search is the most honest indicator of memory a company has.
A company nobody searches for by name pays full price for every customer, because the market has not yet formed a cognitive ownership tied to its name. I explain the mechanism at greater length in the article on cognitive ownership.
When does it make sense to raise the marketing budget?
Raising the budget makes sense once the foundation can carry the extra money. The sign is a small test in which every additional euro brings in at least as much as the euro before it.
That test only runs after the attribute and its proof are visible at comparison, and after the commercial process picks up the leads without losing them along the way.
The small test is the part most companies skip entirely. I refuse to start with a lot of money at once, even when the client already has the budget sitting ready. We start with small daily amounts, on the same audience, with different message variants, calibrate on what works, and only then put real money behind the variant that won.
- 1 · DiagnosisThe broken layer, found in signs already sitting in the reports
- 2 · Attribute and proofThe reason to choose, on the home page
- 3 · Small testSmall amounts per day, the same audience, different messages
- 4 · Larger budgetOnly on the variant that won the test
This order is a sequence that gradually educates the market, and every step carries its own purpose. The first step sells nothing, it only shows where the money is getting lost today.
The second prepares the message, the third checks it on a small amount of money, and the fourth scales only what has already proven itself in front of real buyers.
Skipping steps means burning stages, and the cost of the burn gets paid in budget, not in time saved. A company that puts real money behind an untested message finds out three months later that the message did not work, while the invoice kept arriving every single month in between.
The same company would have learned the same lesson in two weeks, for a fraction of the amount spent.
There is one more rule I hold to strictly, without exceptions for an eager client. The promotion budget stays frozen until the product and the website are ready to receive the people it brings in.
Sending paid traffic to an unfinished page means paying for a bad first impression, and the bad impression stays in the buyer’s memory long after the page gets fixed.
Efficiency, in the end, comes from strategy more than it comes from optimisation. Optimisation moves percentages around the same average, while strategy moves the average itself, permanently.
A company that has repaired its foundation usually discovers two things at once. The budget it already had went further than anyone on the team thought it could, and the extra money, invested after the repair, finally has somewhere real to work.
Frequently asked questions
What percentage of revenue usually goes to marketing?
The average reported by Gartner for 2026 is 7.8% of revenue. The percentage varies a lot by industry and by company stage, and for a B2B company between three and thirty million euro it matters more how the budget splits between brand and activation than the exact percentage on a slide.
Why does cost per lead rise even though the budget is rising too?
Cost per lead rises when extra money brings people to a decision point the company does not win. Clicks multiply, while the share of people who leave their details stays the same or falls further. The cause sits almost always in positioning, and the campaign only makes it visible in the numbers.
How do I know if the problem is the budget or the foundation?
Look at what happens to the result when the budget grows. If the result grows proportionally, the foundation can carry the money and the budget can safely rise. If the result grows far slower than the spend, the problem is the foundation, and extra money only makes that foundation more expensive to maintain.
How long does it take to repair the foundation before raising the budget?
The diagnosis and the first fixes to positioning usually take between one and three months, and the small test on a reduced budget takes another two to four weeks after that.
The existing budget stays active during the repair, it just does not grow until the test shows that every extra euro brings in at least as much as the euro before it.
If you want to see which link in the chain is losing your marketing budget today, ask for a diagnostic.